Introduction
Chad Dannecker: Hi, I’m Chad Dannecker with Dannecker & Associates at Compass, coming to you with your Late September San Diego County Housing Market Update.
Closed Price vs. Last List Price
So, I love this chart. This is our closed price versus our last list price breakdown (% of closings):
Closed Below Last List Price (August 2026): 48%
Closed At Last List Price (August 2026): 18%
Closed Above Last List Price (August 2026): 33%
There may have been a price improvement along the way, but it gives us a pretty good gauge on the market. 48% of homes in the market sold below their last list price (which doesn’t account for prior price reductions), 18% closed at list price, and 33% closed above list price.
Single-family homes are carrying the bulk of the “at or above” list price stats—they are by far outpacing condos. It is really, really important to price your home well. There are buyers out there, and we’re seeing a lot of activity right now—especially in the coastal markets.
Interest Rates
Interest rates today are sitting at about 7.2%, up from 5.99% at the end of February. The Iran war is really taking its toll on mortgages.
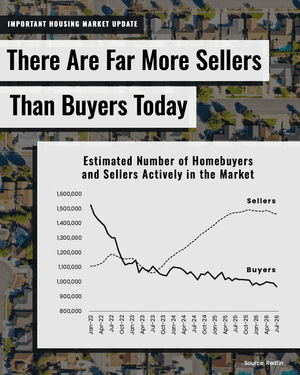
Due to rising mortgage rates, lower demand, and elevated inventory, we expect negotiations to lean toward buyers for the rest of the year. However, it depends on location within San Diego County; key locations in good neighborhoods with good schools—and especially our coastal markets—are performing really well.
Zillow Home Price Index Month-Over-Month
Looking at the Zillow Home Price Index for San Diego County, the market has been pretty flat since September of last year:
We had a small bump in the spring.
Rates went up, and the market came right down.
Year-over-year, there is essentially a 0% gain overall.
The Key Distinction: Single-family homes have gone up in value, while condos have gone down in value. Blended together, they land at a 0% year-over-year net gain.
Active Listings Inventory YOY
Inventory seems to have peaked about a month ago in August (usually, inventory peaks in July, but this year it peaked in August).
Current Active Inventory: 5,981 homes on the market
Last Year (Same Time): 6,010 homes on the market
Inventory Trend: Down about 2% year-over-year.
Demand Year-Over-Year
Demand is down approximately 11% from the same time last year. Last year, interest rates were 1% lower at this time, and that 1% difference creates a substantial shift in a high-priced market like San Diego.
Pre-COVID Comparison: Looking at the 3-year average prior to COVID, there was 83% more demand than there is this year. High prices combined with current interest rates have created a gridlock where homeowners locked into 3% rates (from 2020–2022) are choosing to wait rather than move up or down.
Expected Market Time
Blended expected market time (single-family homes and condos combined) is sitting at 106 days.
Condos: Increased from 124 days to 132 days expected market time.
Detached Homes: Decreased from 103 days to 99 days expected market time.
Coastal Market Activity Examples
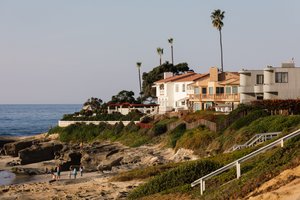
Despite broader market slowing, well-priced coastal properties continue to move quickly:
Ocean Beach: Listed at $1.6M - Received 10 offers - Sold over $100,000 above list price.
Sunset Cliffs: Listed over $5M - Received a full-price cash offer.
Mid-$2.7M Range Property: Received multiple offers in hand.
Pacific Beach & Crown Point: Properties are consistently selling at or above list price.
Market Time by Price Range
Here is the breakdown of market speed across San Diego County price ranges:
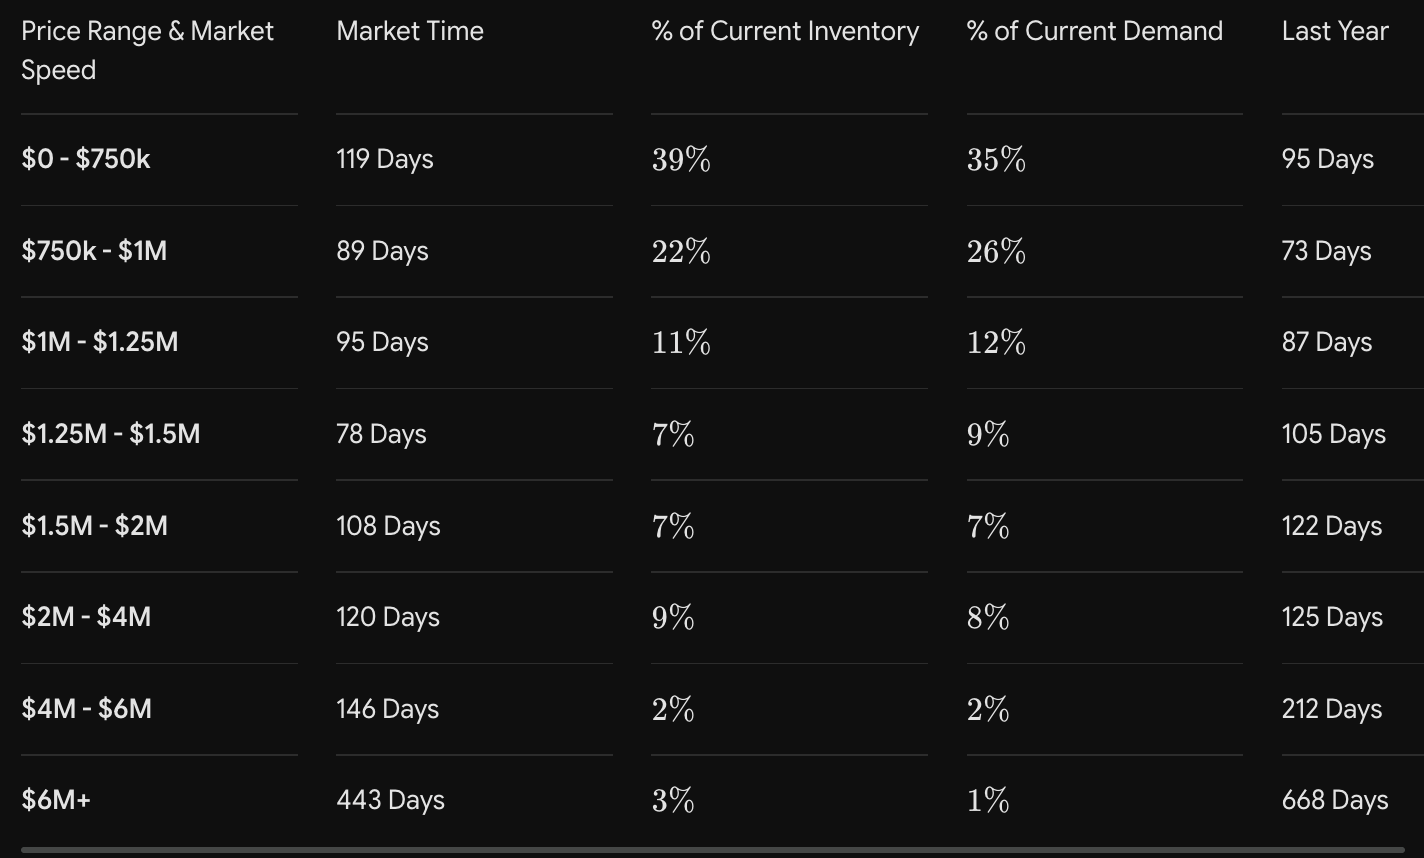
In the ultra-luxury segment ($6M+), market time is 443 days—which is significant, but substantially lower than last year’s 668 days. Coastal prime locations pull that average down, whereas inland high-fire zones (such as parts of Rancho Santa Fe, Rancho Bernardo, and Poway) experience longer hold times.
Conclusion
My name is Chad Dannecker. If you have any questions about the real estate market, I’m always happy to help you out. Have a great end of summer, and we’ll talk to you soon!